
Make machine learning powered predictions from the safety and comfort of your own spreadsheet.
Autofill missing values with neural networks.
Powered by TensorFlow.js.
This tool operates on a spreadsheet table. One column is identified as the output/prediction column, and the others are treated as inputs to the machine learning model. All columns should contain numbers or label text (e.g., true/false, English/French/German, mystery/fantasy/memoir).
This tool will generate a machine learning model (composed of a number of dense and embedding layers) for the data, and will begin training the model. After each epoch (round of training), values that were initially missing will be generated. As the training progresses, values should become more accurate.
The Kaggle Titanic competition is a popular test of machine learning methods and models for tabular data. In this competition, the goal is to predict the survival of an individual based on a number of factors (name, age, ticket price, etc.). The most basic application of this tool provides a score of 73%, which is not going to win any awards (but is not terrible). However, combining five minutes of feature engineering within Excel (for example, parsing the individual's title into its own column) with this tool leads to a score of 80%, which is in the top 15% of competition entries.
Instructions
| 1. Install the add-in from AppSource (the Microsoft® Office add-in store). | |
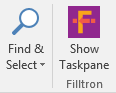
| 2. Launch the add-in by clicking the Filltron button from the Home tab ribbon. |
|
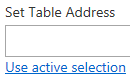
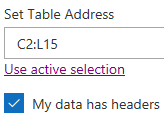
| 3. Set the table address in the taskpane display. You may either enter the address in A1 style, or simply select your full table then click "Use active selection". |
|
| 4. Toggle the checkbox depending on whether the table you have defined includes header labels. |
|
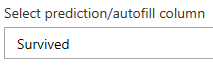
| 5. Select the column that will contain the output/prediction values. This column should contain values in some cells (in order to train your data) but not in all cells (the empty cells will contain the predictions). |
|
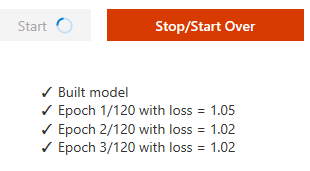
| 6. Click the start button to begin the process. Progress will be tracked below the start button. You can click the "Stop/Start Over" button at any time to stop the process. Any prediction values that have already been generated will remain in your spreadsheet. Generated values are highlighted in light blue. |
|
FAQ
- It's been 3 minutes and the page just says it has built the model. Is it working? What is taking so long?
- Depending on your hardware, it may take a long time to complete a single iteration of training. If it is taking too long, you may wish to reduce the number of input features (i.e., remove a column or two) or reduce the number of training instances (i.e., remove some rows). Or just let the process run overnight!
- Do I need to wait for all 120 epochs to complete? That would take days!
- No, you do not need to wait for all epochs to complete. In general, generated values will become more accurate as the epochs progress. However, if the "loss" value is staying pretty much the same from one epoch to the next, it is likely that the model is not getting better. At that point you can just click the "Stop/Start Over" button. Any prediction values that have already been generated will remain in your spreadsheet.
- I have a spreadsheet full of free text/survey comment data. It's currently training, but the predictions are really bad. What is the problem?
- In general, free text data (i.e., text that can't be treated as a label) is not a good match for this kind of machine learning. If all (or nearly all) of your text values are "unique", they won't provide much value here, and will likely be ignored in the building of the model. So "true/false" or "car/van/truck" columns would work great, but columns with values like "Once upon a time..." would not.
- Is my data being stored on your servers? Can you see my data?
- We cannot see your data, and no spreadsheet data is sent to our servers at any point. All machine learning computation is performed only on your own computer.
Contact us
Privacy
We do not collect or store any of your data.